
Class 8 Social Science Part II Chapter 6: Dynamics of Population Solutions
These Class 8 Social Science Part 2 Chapter 6 solutions explain Dynamics of Population. Learn how births, deaths, migration and age structure influence population change, and practise reading demographic graphs with their units and dates.
Use the chapter title and Part II numbering to match your school textbook. These are original ClearStudy explanations. Open-ended tasks have sample answers; your observations and local examples may differ. Question prompts are shortened for reference; read the complete tasks in your textbook.
- Chapter overview and revision
- The Big Questions
- In-text questions and activities
- Questions and activities: exercise solutions
- Frequently asked questions
Dynamics of Population: chapter overview
Demography studies population size, composition, distribution and change. Population change over a period equals births minus deaths plus immigration minus emigration. Movement within a country changes local populations but does not itself add to the country’s total population.
| Indicator | Meaning / unit |
|---|---|
| Birth rate | Live births per 1,000 population in a year |
| Death rate | Deaths per 1,000 population in a year |
| Total fertility rate | Average births per woman implied by current age-specific fertility rates |
| Life expectancy at birth | Expected years of life under the mortality conditions used; not a guaranteed lifespan |
| Sex ratio, Indian census convention | Females per 1,000 males |
| Age structure | Distribution among age groups; definitions of working age differ across sources |
The chapter’s three-stage transition model moves from high birth and death rates, through falling deaths with high births, to lower births and deaths. It is a simplified model; countries do not follow identical timetables. India’s Census 2001 and 2011 figures are historical counts, while later population estimates and future projections use different methods.
Read figures carefully: low fertility does not necessarily produce immediate population decline, because age structure and migration matter. A large working-age share creates an opportunity, not an automatic demographic dividend. Projection years such as 2030 or 2050 describe possible futures under assumptions. A high overall death rate may also reflect an older population, rather than simply poor healthcare.
The Big Questions
Big Question 1: What is demography?
Demography is the study of human populations: how many people there are, their age and other characteristics, where they live and how these features change. It uses information on births, deaths, migration and population composition to understand trends.
Big Question 2: What are its important concepts?
Key concepts are population size and distribution, birth and death rates, fertility, migration, life expectancy, sex ratio and age structure. A population pyramid displays age groups separately for males and females. Demographic transition describes changing birth and death patterns; demographic dividend describes a possible economic benefit from a favourable age structure.
Big Question 3: How have India’s and the world’s populations changed?
Both grew substantially during the twentieth century as survival improved. India became the world’s most populous country according to UN estimates in 2023. Fertility and growth rates have fallen, but population can continue growing because many people are entering childbearing ages. Countries differ: some are growing quickly, while others face shrinking and ageing populations. Estimates and projections should always identify a year and source.
Big Question 4: How do population trends shape societies and economies?
They change demand for schools, employment, housing, transport, healthcare and elder care. A growing workforce can raise production when people have skills and productive work. Ageing needs accessible services, pensions and care systems. Planning should recognise people’s contribution and dignity at all ages, rather than treating them only as costs or workers.
In-text questions and activities
Follow the textbook page references below. Suggested responses help you reason through discussion, observation and project tasks.
Page 172 — neighbourhood changes: Discuss changes in housing, traffic and green spaces with family members.
A family might report that apartments replaced fields and that traffic became heavier. Possible reasons include migration, more households, employment growth, rising vehicle ownership and changes in land use. These observations do not prove that population alone caused every change. Record the period, examples and the person’s explanation; label the account as an interview only if you actually conducted it.
Page 173 — replacement fertility: Why is replacement fertility often about 2.1 rather than 2?
A little more than two births per woman is needed in low-mortality settings because not every child survives to reproductive age and slightly more boys than girls are usually born. The replacement level can be higher where mortality is higher. It is an approximate long-term threshold, not an instruction that every family must have a set number of children, and it does not ensure immediate stability.
Pages 175–176 — fertility and literacy report: What relationship appears in the selected-state table?
In the textbook table, Bihar has fertility 3.0 and women’s literacy 55%, while Delhi has fertility 1.6 and literacy 83.7%. Karnataka and Punjab also combine relatively lower fertility with higher literacy than Bihar. The overall pattern is an inverse association: higher literacy is generally accompanied by lower fertility in these examples.
Education may support informed choices, later marriage, employment and access to healthcare. Income, urbanisation, child survival and access to reproductive services also matter. Six examples show an association; they do not prove that literacy alone causes a particular fertility rate. Keep the table’s figures identified as textbook data.
Page 177 — migration from villages: What could happen when many young people move to cities?
Villages may have fewer young workers and a higher share of older residents. Migrants may send money home and bring new ideas or skills, but families may be separated and some local work or care needs may become harder to meet. Effects depend on whether migration is seasonal, temporary or permanent, and on local employment and services.
Page 180 — sex ratio: Why might some states have higher female-to-male ratios?
Possible influences include differences in female survival and healthcare, discrimination, age structure and sex-selective migration. Longer female life expectancy can affect the overall ratio in an older population. Compare birth ratios, age groups and migration before drawing a conclusion. A census ratio by itself does not prove one cause or measure every aspect of gender equality.
Page 183 — low fertility and pyramid shape: What happens to the pyramid if fertility stays very low?
The younger age groups become relatively narrower, while middle and older groups form a larger share. In an ageing society there can be fewer children than older people. Over time, deaths may exceed births and population may fall, unless migration and other changes offset the trend. The exercise means fertility below replacement, rather than a ‘replacement rate’ that is arbitrarily defined as less than two.
Page 186 — older people’s contributions: How do older people contribute to families and neighbourhoods?
They may share skills, local history and stories, support childcare, volunteer, advise younger people or continue paid work. Contributions differ by interests, health and circumstances. Ask respectfully for examples from willing neighbours; do not assume that all older people are dependent or that they must provide unpaid care. Society should support their independence and dignity.
Questions and activities: exercise solutions
Answers follow the printed exercise order (pages 187–190).
Question 1: Why should a country study its population?
Population information helps plan schools, hospitals, housing, jobs, transport and utilities. Age structure identifies changing needs, while migration and regional distribution show where services are required. Reliable information also helps evaluate policies and allocate resources fairly.
Question 2: How can low fertility affect the future workforce and economy?
Persistently low fertility can reduce the number of young people entering work later and increase the proportion of older residents. This can change demand, labour supply, pension needs and care services. Education, productivity, employment opportunities, healthy ageing and migration can influence the outcome; decline is not immediate or inevitable solely from one year’s fertility rate.
Question 3: Is a high birth rate always beneficial?
No. More births may eventually expand the workforce, but children need nutrition, education, healthcare and future employment. If services and jobs do not grow appropriately, households and public systems face pressure. The goal is people’s wellbeing and informed choices, not simply maximising the number of births.
Question 4: Is having more or fewer people better? Compare the challenges.
Neither is automatically better. A fast-growing population needs expanding services, housing and productive jobs. A shrinking or ageing population may face labour shortages, pension pressures and changing settlement patterns. Resources, institutions, age structure, distribution and productivity influence the balance. My view is that good planning and equitable opportunities matter more than a simple large-versus-small judgement.
Question 5: How does age structure affect jobs and services?
A child-heavy population needs teachers, schools, child healthcare and learning materials. A large working-age group needs training and productive employment across agriculture, industry and services. An older population needs accessible housing, healthcare, rehabilitation, care workers and appropriate pensions. Every population needs some of all these services; their relative demand changes with age structure.
Question 6: Why are families getting smaller, and what are the effects?
Possible influences include better child survival, education, later marriage, urban living costs and access to voluntary family planning. Fewer children may allow more resources per child, but good education and health are not guaranteed without income, services and supportive care. Smaller families may change sibling relationships and support networks; ageing can increase care needs. Shared household responsibilities and suitable childcare can help.
Question 7: Read the life-expectancy graph, including 2010 values.
(a) The graph shows a long-term increase, associated with improvements in healthcare, vaccination, sanitation, nutrition and living conditions. Individual years can differ from the trend.
(b) Reading the textbook’s plotted points at 2010 gives approximately 66 years for males and 69 years for females. These are graph readings, not exact statistical table entries. Trace vertically from 2010 to each line, then horizontally to the years axis. The graph also extends into future years; those points must not be described as already observed lifespans.
Question 8: Explain the demographic dividend and what India should do to benefit.
A demographic dividend is a potential economic gain when the working-age share is relatively large and people can be healthy, skilled and productively employed. India needs good schooling, healthcare, vocational skills, job creation and opportunities for women and disadvantaged groups. Affordable childcare and fair sharing of unpaid care help participation. Savings, sound institutions and infrastructure also matter. The chapter’s period before 2050 is an opportunity for investment, not a promise of automatic growth or a uniform deadline for every state.
Question 9: Compare two countries using population, fertility, life expectancy and age distribution.
Dated example: India and Japan, 2024. Values are rounded from World Bank World Development Indicators, checked in October 2026. Use one reference year and keep the units consistent.
| Indicator (2024) | India | Japan |
|---|---|---|
| Population | 1,450.9 million | 124.0 million |
| Total fertility rate (births per woman) | 1.96 | 1.15 |
| Life expectancy at birth (years, both sexes) | 72.2 | 84.0 |
| Ages 0–14 (% of population) | 24.6% | 11.4% |
| Ages 15–64 (%) | 68.2% | 58.8% |
| Ages 65+ (%) | 7.1% | 29.8% |
Japan has a much larger older-age share and lower fertility, while India has a larger child and working-age share. Long-standing differences in fertility, survival, development and migration help explain this. Ageing societies can strengthen healthcare and care services, improve accessible housing and support willing older workers; technology may assist but does not replace human care.
Sources: World Bank country comparison; indicators SP.POP.TOTL, SP.DYN.TFRT.IN, SP.DYN.LE00.IN, SP.POP.0014.TO.ZS, SP.POP.1564.TO.ZS and SP.POP.65UP.TO.ZS. This is a researched sample; other country pairs are valid.
Question 10: Prepare a questionnaire about local migration.
Explain the school project and obtain voluntary agreement before asking questions. Use an anonymous code; a name should be optional and kept private.
- What age group are you in?
- What is your occupation, if you wish to say?
- Which town or broad locality do you live in? Do not request an exact address.
- How many years have you lived here?
- Did you move from another town, village, state or country? Is the move temporary, seasonal or permanent?
- What factors influenced the move: employment, education, housing, family, facilities, safety, environment or something else?
- What attracted you to this place?
- What challenges or improvements would you like to mention?
Allow ‘prefer not to answer’. Present aggregate findings rather than identifiable records. Do not ask about legal status, income or sensitive experiences unless your teacher has a justified, carefully designed plan.
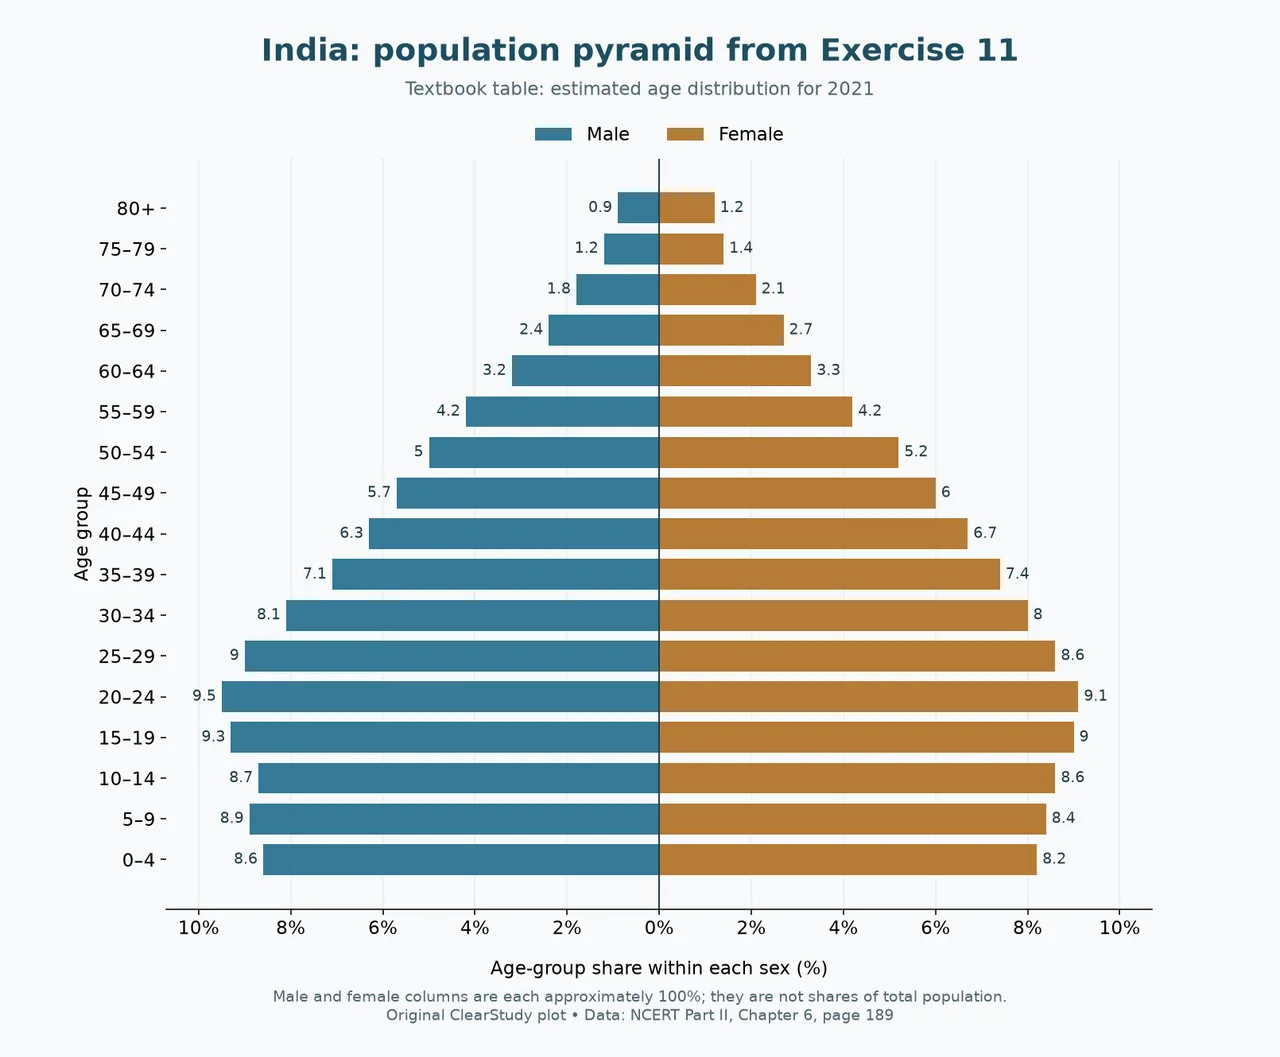
Question 11: Draw India’s population pyramid using the estimated 2021 table.
Place age groups vertically, youngest at the bottom and 80+ at the top. Plot male percentages to the left and female percentages to the right of zero, using equal scales. A scale from 0 to 10% on each side accommodates every value. Bars have equal heights; their lengths represent the printed percentages. Label the year, age groups, units and each side.
The supplied male column totals about 100% and the female column about 100%, so interpret the entries as age distributions within each sex, not as two columns of percentages of the total population. Do not halve them or convert them to millions without additional population totals. The 20–24 group is the largest on each side (9.5% male, 9.1% female). The lower middle is wider than the oldest groups, showing a large young-adult share.
The original ClearStudy plot above uses every entry from the exercise table, including 8.6% and 8.2% for ages 0–4. It is labelled an estimate for 2021, not a new census result.
Question 12: Interpret Japan’s 2023 population pyramid.
The youngest age groups form a narrow base, while many middle-aged and older groups are wider. This indicates low recent births and an ageing population. The female side is wider in many of the oldest groups, consistent with longer female survival. There are noticeable bulges around older and middle-age cohorts, so the profile is not a smooth triangle.
The structure suggests a need for healthcare, elder care and accessible services, and possible challenges in replacing retiring workers. It does not alone prove the exact future growth rate: births, deaths and migration must also be considered. Its horizontal unit is millions, unlike the percentage exercise for India.
Frequently asked questions
Does fertility below 2.1 mean the population immediately falls?
No. Population momentum, survival and migration may allow growth to continue for years.
Is working-age population the same as employed population?
No. Working age is an age classification; many people in that group are studying, seeking work or outside paid employment.
Are the 2021 pyramid entries census counts?
No. The exercise labels them estimated percentages. Keep that label and the percentage units.
Textbook reference: NCERT, Exploring Society: India and Beyond, Grade 8, Part 2, first edition June 2026, Chapter 6, “Dynamics of Population”. Compare with your school’s copy; official NCERT textbook portal. Further clarification: UN World Population Prospects on estimates, projections and population momentum. ClearStudy is an independent study resource.