
Class 8 Social Science Part II Chapter 7: India’s Urban Landscape Solutions
These Class 8 Social Science Part 2 Chapter 7 solutions explain India’s Urban Landscape. Study why cities grow, how rural and urban places depend on each other and how inclusive planning can improve housing, mobility and environmental quality.
Use the chapter title and Part II numbering to match your school textbook. These are original ClearStudy explanations. Open-ended tasks have sample answers; your observations and local examples may differ. Question prompts are shortened for reference; read the complete tasks in your textbook.
- Chapter overview and revision
- The Big Questions
- In-text questions and activities
- Questions and activities: exercise solutions
- Frequently asked questions
India’s Urban Landscape: chapter overview
Cities concentrate people, jobs, markets, institutions and transport links. Their economies can grow through access to resources, trade, specialised industries, education, administration and tourism. Urbanisation means a growing urban share of the population; migration, natural population increase and changes in settlement classification can all contribute.
Population density = resident population ÷ area. Keep both figures from the same boundary and use square kilometres for people/km². A satellite image shows built-up land, not a direct count of residents. High density can support efficient services when well planned; poorly served settlements can face severe pressure.
| Urban advantage | Example from the chapter |
|---|---|
| Industry and resource links | Jamshedpur and steel production |
| Port, trade and financial services | Mumbai |
| Education and technology clusters | Bengaluru and Hyderabad |
| Specialised production | Moradabad brasswork; Tirupur textiles; Channapatna toys |
| Heritage and pilgrimage | Agra, Varanasi and Amritsar |
| Administration and regional connections | Delhi and the National Capital Region |
Definition note: India’s Census 2011 definition does not classify every place with 5,000 people as urban automatically. Statutory towns are recognised under law. A census town also meets criteria for density and non-agricultural male main workers. Use a dated official definition when comparing countries or figures.
Sustainable planning combines housing, livelihoods, transport, water, drainage, waste systems, public spaces and ecological protection. Residents of informal settlements contribute to city life and deserve services and dignified participation; poverty or density should not be treated as proof of criminality.
The Big Questions
Big Question 1: How do cities become centres of diverse economic activity?
Location, transport and markets attract businesses and workers. Once firms, services and skilled people gather, they can share suppliers, customers and ideas. Manufacturing, trade, administration, education, tourism and culture can then support each other. There is no single path: a port, a resource-linked industrial centre and a university city may develop differently.
Big Question 2: How can urbanisation affect people’s lives?
It may bring employment, education, healthcare, transport and cultural opportunities. It can also increase housing costs, travel time, pollution and inequality when services fail to keep pace. Experiences vary by income, work, age, disability and neighbourhood, so improvement should be measured for all residents.
Big Question 3: What challenges do cities face?
Challenges include affordable housing, reliable water and sanitation, congestion, air pollution, waste, flooding, heat, safe mobility and loss of green spaces. Climate change can intensify several risks. Weak planning and unequal access can be as important as the number of residents.
Big Question 4: How can effective planning improve urban life?
Planning can locate homes near services and suitable jobs, connect public transport with walking and cycling, protect drainage and green spaces, and provide accessible facilities. Citizen participation helps identify real needs. Plans should be reviewed as population, livelihoods and environmental risks change, and supported by maintenance and fair implementation.
In-text questions and activities
Follow the textbook page references below. Suggested responses help you reason through discussion, observation and project tasks.
Page 192 — your settlement: Describe where you live and compare rural and urban features.
Record the settlement’s name and observed features: types of work, building pattern, open land, services, roads and local government. For example, a town may have shops and schools but also farms nearby. Rural places have non-farm livelihoods too, and cities may contain agriculture. Observations help describe a place; official classification requires the appropriate government or census source.
Page 193 — satellite comparison: What do the Haryana village and Gurugram images suggest?
The village image shows larger open agricultural parcels, while Gurugram has a more continuous built-up pattern and road network. The city is likely to have more people concentrated per unit of built-up area because of jobs, housing and services. However, exact density needs population and area data: building coverage alone cannot reveal household size, empty buildings or daytime commuters.
Pages 194–195 — Electronic City images: Compare the textbook’s 2012 and 2025 Bengaluru views.
The later view shows denser and more extensive building coverage, with several formerly open or green patches appearing developed. Roads and transport infrastructure are also visible. Possible causes include growth of technology-related employment, housing, shops and transport connections. The images support observations about land use, but they do not alone establish the exact population increase or prove the cause of each change.
Page 195 — generations project: Interview adults about changes in their settlement.
Ask willing participants from different age groups when they first knew the place, what changed in buildings, work, transport and water, what they value now and what they miss. Record approximate dates and distinguish personal memories from verified statistics. Compare common and differing views, then prepare a presentation with sources and permitted photographs. Do not invent responses or publish private addresses.
Page 198 — Surat’s specialisation: Why did Surat become a textile and diamond-processing hub?
Trading links, entrepreneurial networks, skilled labour and clusters of specialised firms helped production and processing develop. Suppliers, training, finance and markets supported related businesses. Once a cluster forms, firms benefit from nearby skills and services; natural resources alone do not explain every specialised urban industry.
Page 203 — nearby cultural traditions: Research traditions, cuisines or customs in nearby towns.
Choose a nearby place and record a well-supported example, such as a craft, food, annual celebration or cultural institution. Explain how it connects people and supports livelihoods. Use local cultural sources or willing interviewees and acknowledge variety within the place. A city is not culturally uniform, and one familiar food does not represent every resident.
Pages 203–204 — informal settlements: What difficulties might residents face?
Possible difficulties include insecure housing, crowded rooms, unreliable water, shared sanitation, poor drainage, unsafe electricity and limited access to schools or healthcare. Many residents support city services through informal work. Good responses improve services, affordable housing and secure livelihoods with residents’ participation, rather than blaming people for gaps in provision.
Questions and activities: exercise solutions
Answers follow the printed exercise order (pages 212–214).
Question 1: What features do cities commonly share?
They usually concentrate residents, buildings, non-farm livelihoods, markets, institutions and transport or communication networks. Cities often have local urban bodies and a variety of cultural and public facilities. Size and form vary, so every city need not have high-rise buildings, a metro or every listed service.
Question 2: Explain growth and migration in a nearby town or city.
Example: Bengaluru attracts people for technology, education and other services, creating demand for housing, retail and transport. People may also move because jobs or facilities are limited at their origin. For your locality, identify actual employers, educational institutions or transport developments and check a dated population source. Migration is one reason for growth; births and boundary changes also matter.
Question 3: Who participates in making a city, as suggested by the epigraph?
Residents, workers, vendors, businesses, planners, engineers, elected representatives, public-service staff and community groups all contribute. They build and maintain infrastructure, supply goods, provide care and services, create culture and communicate local needs. Children, older people and people with disabilities should also influence decisions affecting them. A city works through many contributors, not only its most visible buildings or wealthy investors.
Question 4: How do rural and urban areas affect and support each other?
Cities depend on rural areas for food, raw materials, labour, water and ecological services. Rural areas may use urban markets, healthcare, education, finance and equipment. Migration and remittances connect households. Urban expansion can change rural land use, raise land prices or reduce farmland. Better transport, fair markets, locally appropriate employment and protection of resources can support both.
Question 5: What is urban planning, and what happens if sustainability is ignored?
Urban planning coordinates land use, infrastructure and services for present and future needs. Ignoring sustainability can destroy wetlands or forests, worsen flooding and heat, lengthen journeys, pollute water and create poorly served housing. Expansion also affects neighbouring rural communities. Plans should protect ecological functions, support livelihoods and include the people affected.
Question 6: Observe good and poor planning in your neighbourhood.
A sample observation table could record: shaded, continuous footpaths make walking easier; safe crossings help children; blocked drains cause waterlogging; a bus stop without a usable path excludes some passengers; accessible toilets and parks support wider participation. Replace these with observations you actually make. Note location and date, explain who is affected and suggest a feasible improvement.
Question 7: Plan an inclusive city for children, older people and people with disabilities.
Provide connected accessible paths, safe crossings, usable toilets, affordable public transport, seating, shade and clear signs. Place schools, healthcare and parks within practical reach of homes. Consider wheelchair access, varied sensory and learning needs, reliable lighting and maintenance. Consult users before deciding solutions, and have qualified designers follow applicable accessibility standards. An attractive facility is not inclusive if people cannot reach or use it.
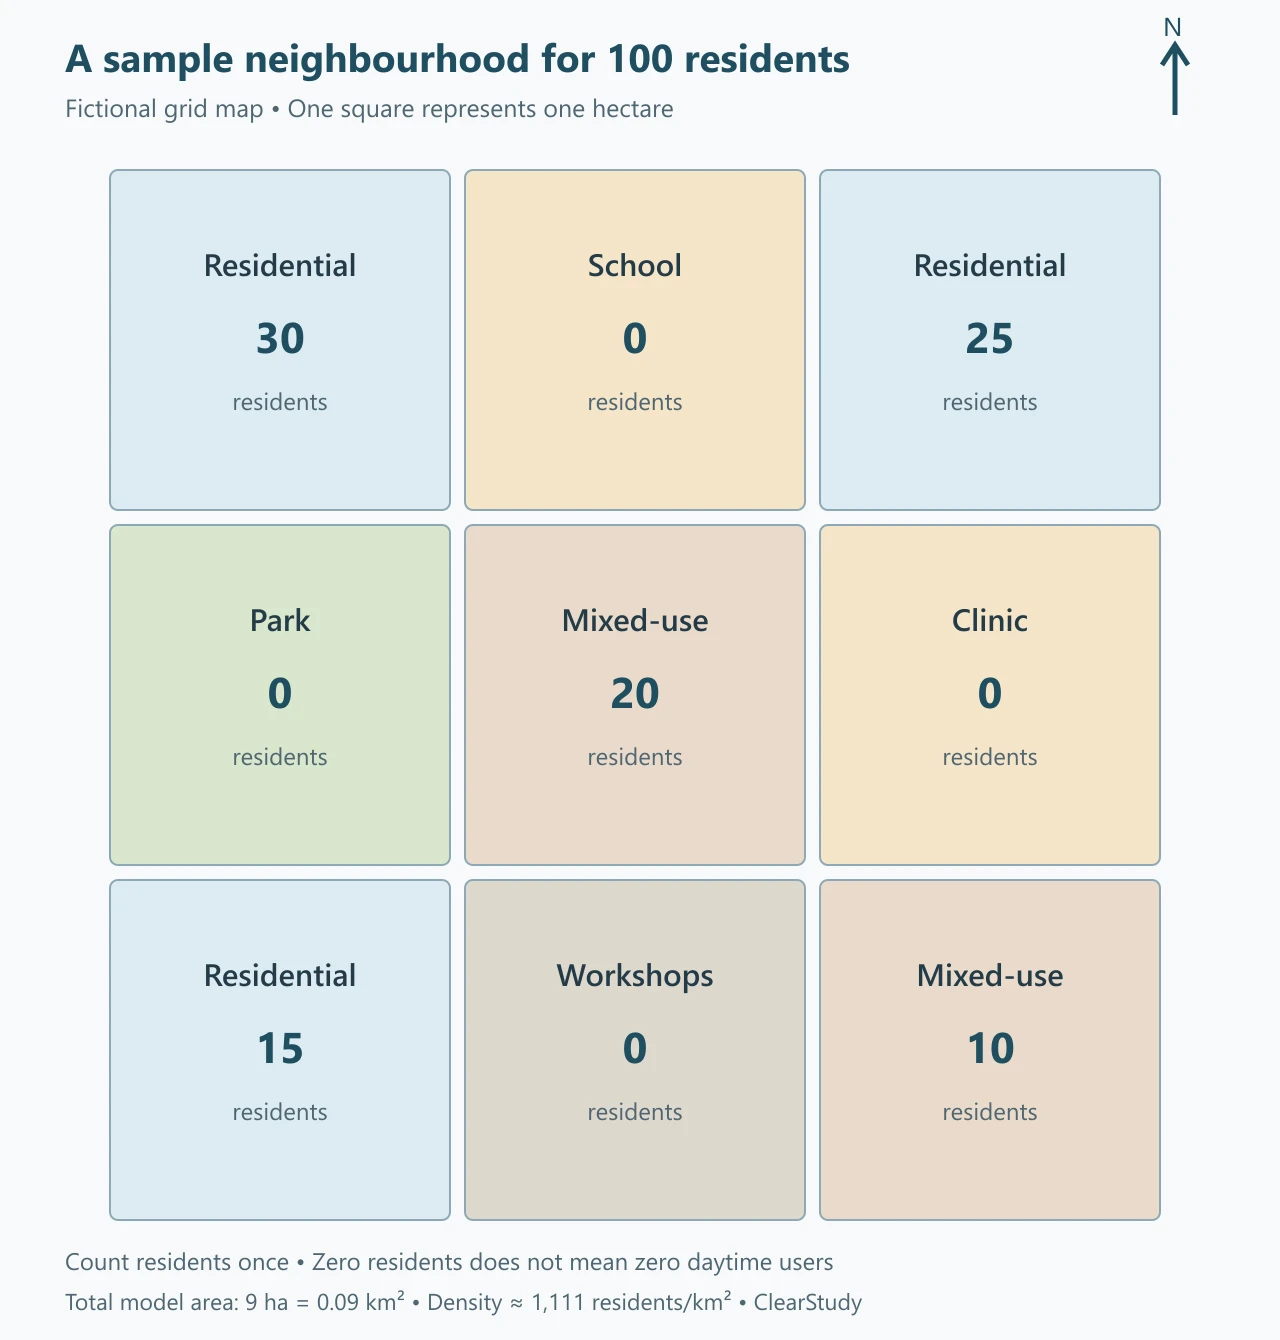
Question 8: Map a settlement of 100 people and explain their distribution.
One possible three-by-three grid is the original map above. Residential squares contain 30, 25 and 15 residents; two mixed-use squares contain 20 and 10. The school, park, clinic and workshop squares have zero permanent residents in this model. Total: 30 + 25 + 15 + 20 + 10 = 100.
Each square represents 1 hectare, so the nine-square model covers 9 hectares = 0.09 km². Average density = 100 ÷ 0.09 ≈ 1,111 residents/km². The square with 30 residents is the most densely populated. The zero-resident service squares can still have many daytime users; do not count a person again when they go to school or work. This is a fictional allocation, not a map of an actual town or a complete engineering plan.
Question 9: Compare Mumbai and Gangtok’s population density and possible reasons.
Use comparable municipal boundaries, not Mumbai’s metropolitan population divided by its city area or Gangtok district data substituted for the town. A dated worked example uses Census 2011 populations and the areas reported by the cited official sources:
| Municipal area | 2011 population | Reported area | Calculated density |
|---|---|---|---|
| Greater Mumbai | 12,442,373 | 480.24 km² | ≈25,909 people/km² |
| Gangtok | 100,286 | 19.2 km² | ≈5,223 people/km² |
These calculations use BMC’s population-and-area pair and the official urban sanitation publication’s Gangtok profile. Other boundary or land-area conventions produce different densities; they are historical examples, not current resident counts derived from the satellite pictures.
Mumbai’s large concentration of employment, port and financial activities and constrained land have encouraged dense development. Gangtok’s smaller population, mountainous setting and different economic scale produce a different settlement pattern. Topography and total population both matter; hills alone do not determine density.
Question 10: Research Beijing’s air-pollution measures and lessons for India.
UNEP’s 2019 review describes controls on coal-related pollution and vehicle emissions, changes in energy infrastructure and a sustained monitoring and management programme. It reports a 35% fall in PM2.5 in Beijing between 2013 and 2017. This is evidence for that period, not a statement that all pollution has disappeared.
Indian cities can identify major local and regional sources, strengthen industrial and vehicle compliance, improve clean public transport, prevent waste burning and manage construction dust. Reliable monitoring and public reporting help assess results. Measures need regional coordination and attention to affordability and livelihoods; one short-term traffic restriction cannot solve all sources.
Question 11: Interview someone who moved from a village to a city.
Ask why they moved, when, what work or education they found, what housing and travel challenges they faced and how relationships changed. Ask what they value in both places. Present only answers they actually gave, with consent, and allow questions to be skipped. If an interview is unavailable, provide this plan and label any imagined example as fictional.
Question 12: Adapt urban-planning ideas from another city to your locality.
Singapore’s connected public transport, walking routes, parks and mixed-use neighbourhoods offer ideas. A local proposal could connect a bus stop, school and clinic with shaded accessible paths and safe crossings. Jaipur’s planned streets and market organisation illustrate a different historical approach. Adapt ideas to local climate, terrain, budgets and residents’ needs rather than copying a city’s design wholesale.
Question 13: Suggest action points for the listed urban challenges.
| Challenge | Suggested actions |
|---|---|
| Waste management | Segregate at source; dependable collection; compost appropriate organic waste; safe handling of hazardous waste |
| Traffic congestion | Reliable public transport, walking and cycling links; sensible parking management; appropriate carpooling |
| Residents’ safety | Usable lighting, safe crossings, emergency access, responsive public services and community participation |
| Poor mobility | Connected bus/rail services, accessible stops, continuous footpaths and affordable fares |
| Expansion of poorly served settlements | Affordable housing, services and appropriate upgrading, with secure livelihoods and resident consultation |
| Summer heat | Shade trees, cool roofs, protected green spaces, drinking-water access and heat-response plans |
Choose a local priority, identify the responsible agency, propose an achievable step and a way to measure progress. Fees or taxes should be assessed for fairness and accompanied by practical alternatives.
Question 14: Research a slum-rehabilitation programme and its possible benefits.
A research example is Mumbai’s Slum Rehabilitation Authority, which implements housing-rehabilitation schemes for eligible residents. For a specific local case, verify its name, location, completion or handover status and residents’ experience. Do not describe a proposed project as a completed relocation.
Possible benefits include more secure housing, sanitation, water, safety and access to services. Outcomes also depend on maintenance costs, space, transport, livelihoods and whether community networks are preserved. Ask residents through an appropriate, voluntary school project rather than assuming every move is beneficial. If your area has no verified example, state that and compare a documented case elsewhere.
Frequently asked questions
Can density be calculated from a satellite photograph alone?
No. You need a resident count and an area for the same boundary. Images help describe land use.
Is every settlement with 5,000 people automatically urban in India?
No. Statutory recognition or the full census-town criteria must be considered.
Does zero on the sample map mean a place is unused?
No. The map counts residents once; schools, clinics and workplaces may have many daytime users.
Textbook reference: NCERT, Exploring Society: India and Beyond, Grade 8, Part 2, first edition June 2026, Chapter 7, “India’s Urban Landscape”. Compare with your school’s copy; official NCERT textbook portal. Definitions: Indian Economic Service explanation of Census 2011 urban criteria. ClearStudy is an independent study resource.